 Buoywatch

The buoy rides the waves
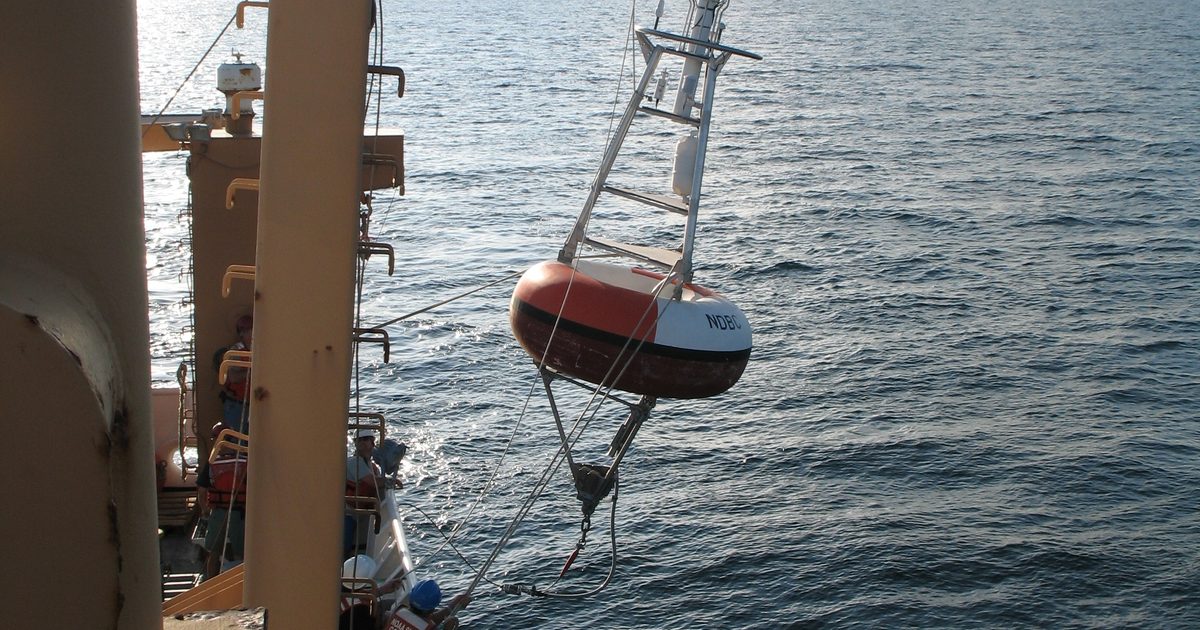
A wave buoy floats on the surface and moves with every wave that passes. Sensors inside, such as accelerometers or GPS receivers, record how it rises, falls and moves sideways many times a second. The Datawell Waverider buoys used by the Coastal Data Information Program (CDIP) at Scripps, for example, measure their displacement in three directions.
From motion to a wave spectrum
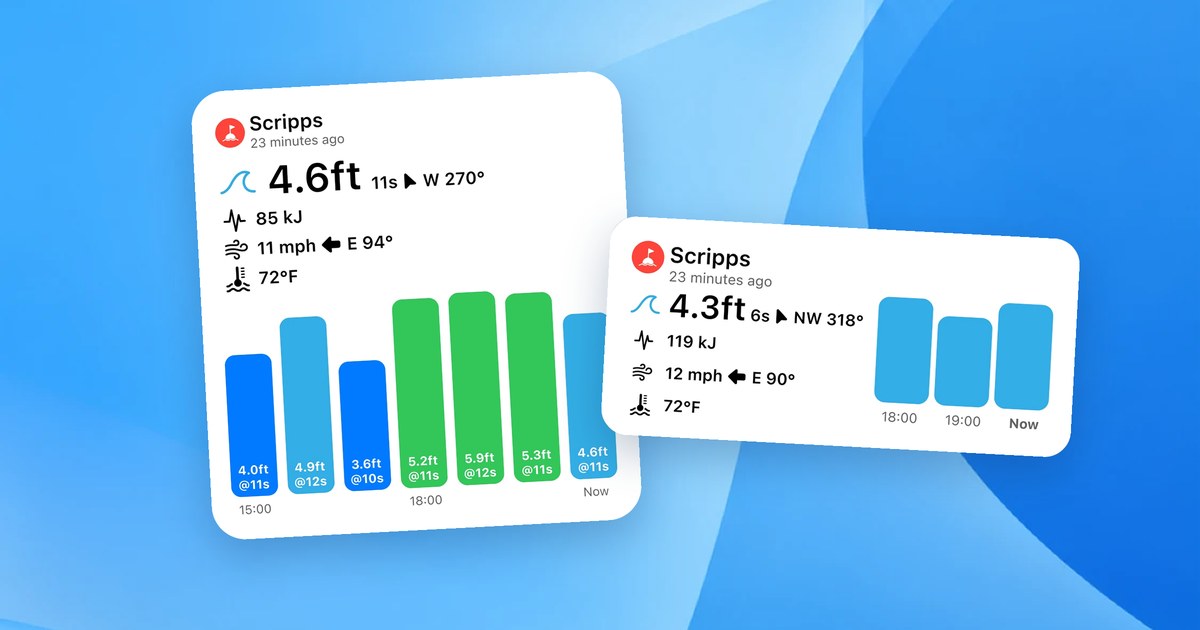
Over a sampling period, about 20 minutes on NOAA’s National Data Buoy Center buoys, the motion record is analysed into a wave spectrum: how much energy the sea holds at each wave period. From that spectrum come the numbers on a buoy report:
- Significant wave height, close to the average of the highest third of the waves. See Significant Wave Height Explained.
- Dominant period, the period with the most energy. See Wave Period Explained.
- Mean wave direction, where the dominant waves are coming from, from buoys that measure sideways motion too.
Other sensors
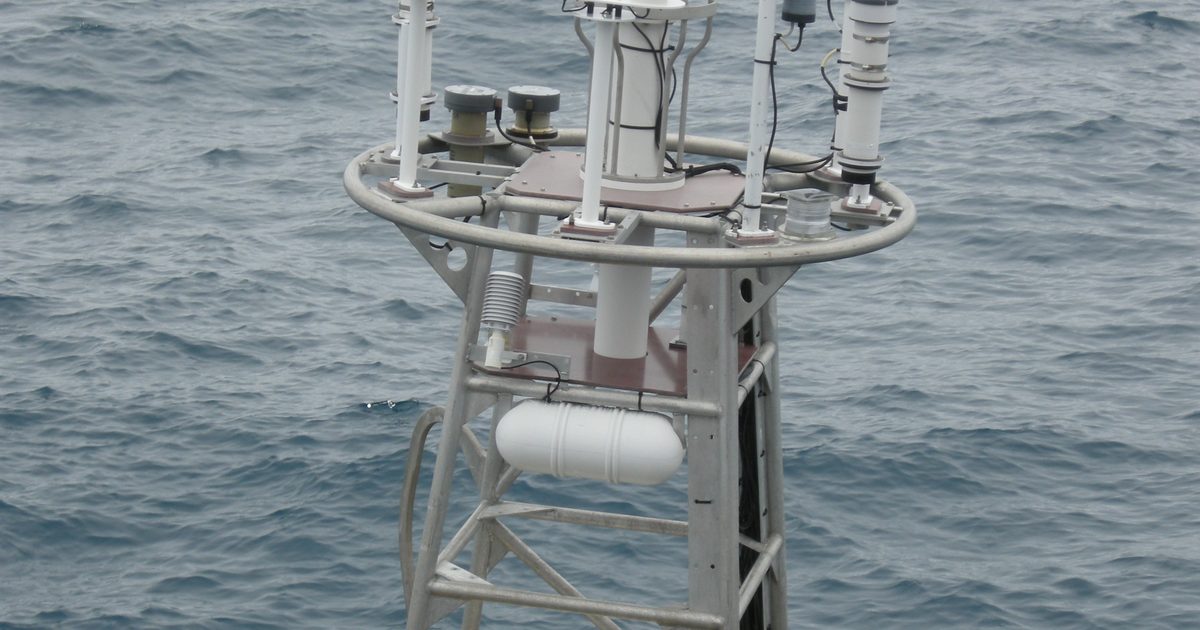
Many NOAA buoys also carry a weather station measuring wind speed and direction, air temperature and pressure, and a sensor for water temperature. Smaller nearshore wave buoys may report only waves and water temperature, which is why some readings are missing on some stations.
What this means for you
A buoy reading summarises about 20 to 30 minutes of sea at one spot. Individual waves vary around it, and conditions at your beach can differ. Read the trend over several hours, and pair an offshore and a nearshore buoy for the full picture. See How to Read a Surf Buoy Report.