 Buoywatch

What a buoy actually measures
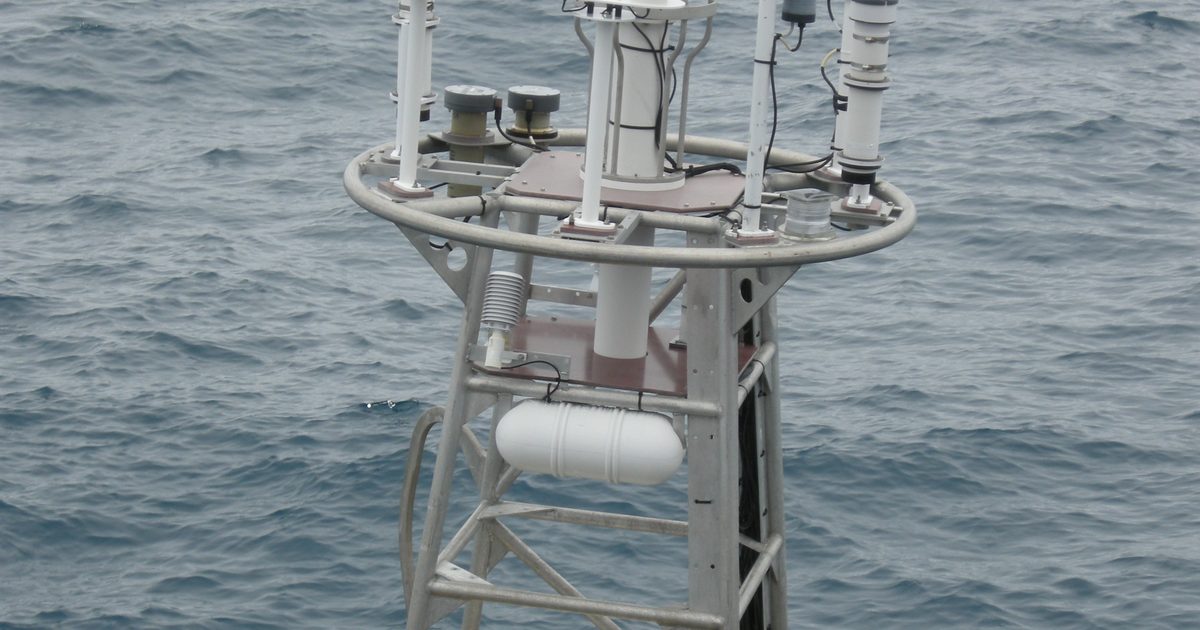
An ocean buoy rides the waves and records its own motion. From a sampling period of about 20 minutes, it calculates a handful of numbers that describe the sea around it. On NOAA buoys, and in Buoywatch, those readings are updated roughly every hour or half hour. They are observations: what the sea did at that buoy’s position, not a forecast for your beach.
Wave height: significant, not maximum
The headline number is significant wave height. NOAA defines it as the average of the highest one-third of all the waves measured during the sampling period. It is a good summary of the sea state, but individual waves vary around it: the US National Weather Service notes that about 15% of waves equal or exceed it, the highest 10% can be 25–30% higher, and roughly once an hour a wave can be nearly twice as high. Read more in Significant Wave Height Explained.
Period: the number surfers watch most
Dominant period is the time, in seconds, between waves in the band carrying the most energy. The same height feels very different at different periods: a 1.2 m swell at 14 seconds usually breaks with much more power than 1.2 m at 7 seconds. Swell that has travelled from a distant storm is typically 10 seconds or longer. Short periods usually mean local wind waves. See Wave Period Explained.
Direction: where the waves come from
Mean wave direction tells you where the waves at the dominant period are coming from, in degrees clockwise from true north: 270° is a swell from the west, 315° from the north-west. Whether a direction works depends on how your beach faces and what shelters it, which is local knowledge worth building over time.
Wind, water and pressure
Many buoys also report wind speed and direction (also “from”), water temperature and air pressure. Wind matters as much as swell: light or offshore wind keeps waves clean, onshore wind blows them out. Not every buoy reports every measurement, so Buoywatch shows only what each station sends.
Read the trend, then the tide
| Reading | What it tells you | Watch for |
|---|---|---|
| Wave height | Size of the sea state | Building or dropping over several hours |
| Period | Power and quality of the swell | Period rising as a new swell arrives |
| Direction | Which coasts the swell reaches | Matching your beach’s exposure |
| Wind | Surface conditions | Offshore or light wind |
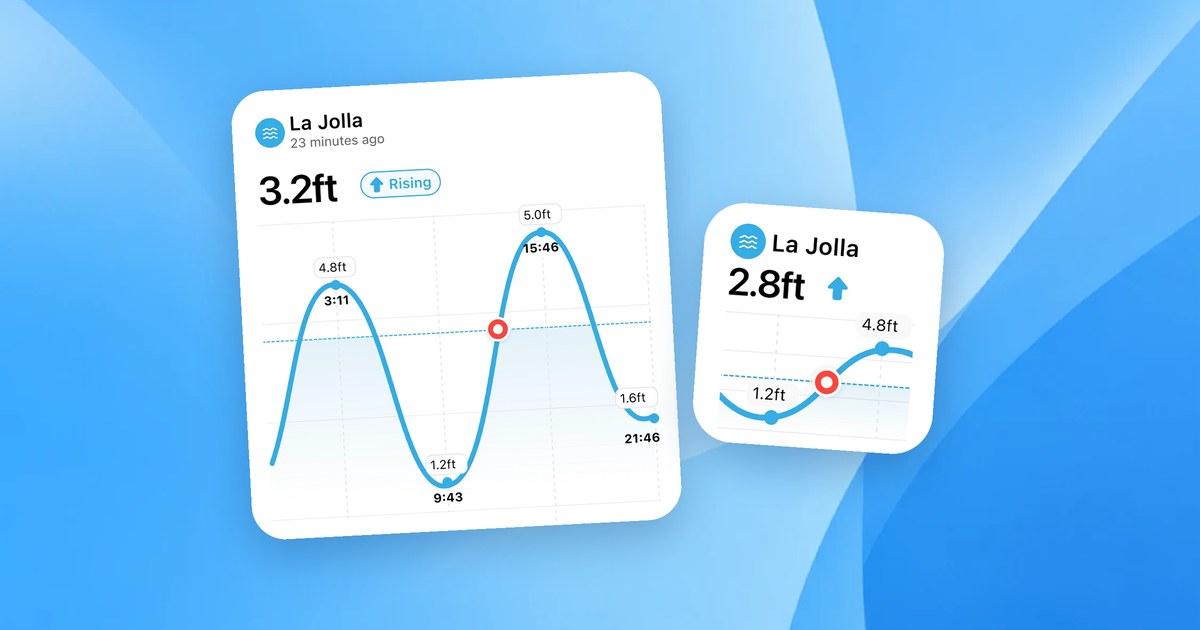
A single reading is a snapshot. The wave history bars on each buoy page, like the Waimea Bay buoy on Oahu’s North Shore or the San Francisco Bar buoy, show whether a swell is building or fading. Then check the tide: many breaks only work on part of the tide. Our guide on reading a tide chart covers that.
An offshore buoy is not your beach
Offshore buoys measure deep-water swell before it reaches the coast. Depth, the shape of the seabed and the angle of the coastline change the waves on the way in. Use the buoy to know what is coming, and your own observations to learn how it translates at your spot.